Ever wonder if your social media posts are actually working? You’re not alone! In today’s world, social media is a powerful tool for connecting with people and growing your business. But how do you know if your efforts are paying off?
The answer lies in social media engagement metrics! These are like little scoreboards that track how your posts are performing. By focusing on the right metrics, you can see what’s working well and what might need a tweak.
This guide will break down 16 key social media metrics you can track in 2024 to improve your chances of turning those online connections into real results, like website visits or sales.
Let’s make your social media efforts shine!
What are Social Media Metrics?
Social media metrics are like tools that help us measure how well our posts and activities are doing on social media platforms. They tell us things like how many people have seen our posts, how many have liked or shared them, and how many have clicked on any links we’ve shared.
They provide insights into various aspects of your social media presence, helping you understand how well your efforts are resonating with your audience and achieving your goals.
What is the Importance of Social Media Metrics?
Social media metrics are the golden compass guiding you towards social media success. Here we are going to talk about how social media metrics are crucial for several reasons:
- Understanding Your Audience
Metrics go beyond vanity metrics (likes and follower count) and provide insights into who your audience is, what content resonates with them, and when they’re most active. This allows you to tailor your social media strategy to their preferences and maximize engagement. - Measuring Campaign Performance
Metrics help you track the effectiveness of your social media campaigns. You can monitor website traffic, lead generation, brand mentions, and other relevant metrics to see if your campaign achieved its goals. This data helps you determine what’s working and identify areas for improvement in future campaigns. - Optimizing Your Strategy
By analyzing metrics, you can understand what content formats, posting times, and types of interactions generate the best results. This allows you to refine your strategy, experiment with different approaches, and ultimately get better results from your social media efforts. - Demonstrating ROI (Return on Investment)
Return on Investment (ROI) metrics help translate your social media efforts into quantifiable results. You can track increases in brand awareness, website traffic, lead generation, or sales driven by social media to demonstrate the value your social media presence brings to the table. - Benchmarking Against Competitors
It allows you to compare your social media performance against your competitors. You can analyze their follower growth, engagement rates, and content types, and identify areas where you can improve your own strategy.
Social media offers a powerful platform to connect with your audience, build brand awareness, and ultimately drive conversions (actions you want users to take, like website visits or purchases).
But how do you know if your social media efforts are paying off? That’s where social media engagement metrics come in.
By tracking the right metrics, you can gain valuable insights into your audience’s behavior and optimize your strategy for better results.
Here are 16 key social media marketing metrics to track for improved conversions in 2024:
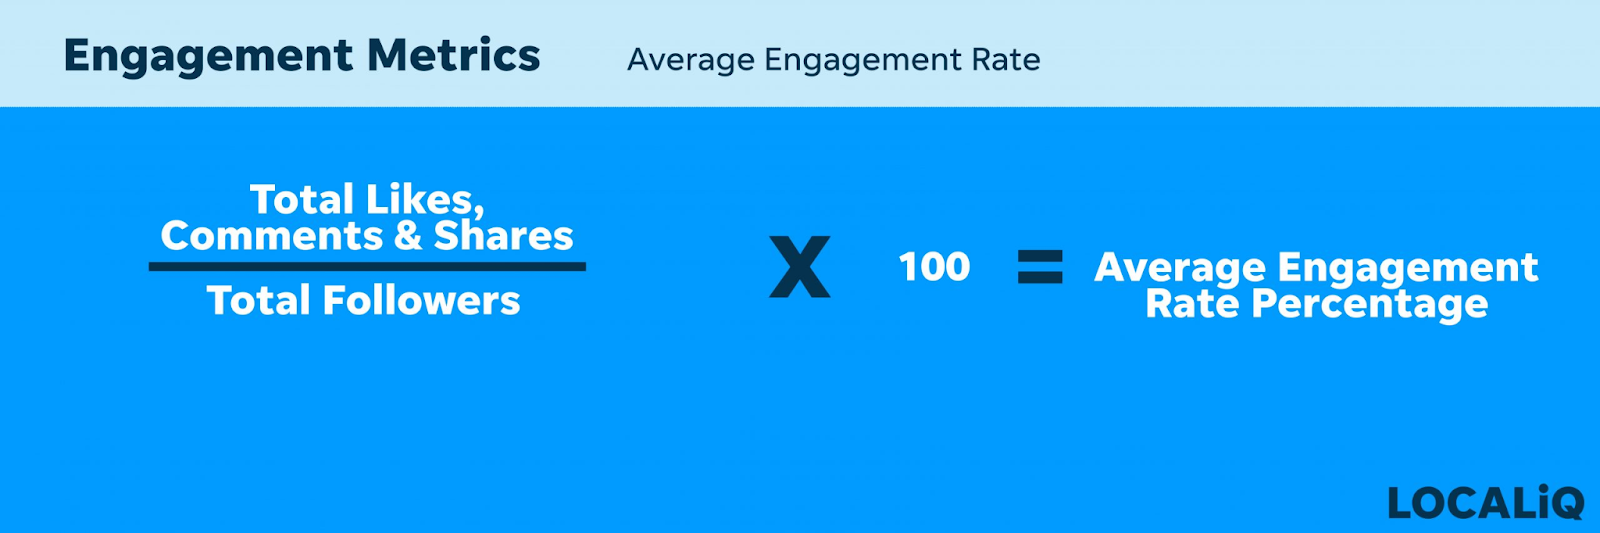
1. Engagement Metrics
Engagement metrics are the pulse of your audience. They track how users interact and resonate with your content. Likes, shares, comments, and time spent are examples of these insights that help you refine your content and keep users engaged.
Likes, Comments, Shares
These foundational metrics provide a window into how actively your audience interacts with your content. A high volume of likes, comments, and shares indicates that your content resonates with your audience.
Likes signify basic approval or enjoyment, while comments delve deeper, sparking conversations and fostering a sense of community. Shares are a powerful endorsement, as users actively spread your content to their networks, extending its reach organically.
You share an informative blog post on LinkedIn that receives numerous comments with insightful questions and discussions. This signifies that your content is valuable, prompts user engagement, and potentially positions you as a thought leader in your industry.
Click-Through Rate (CTR)
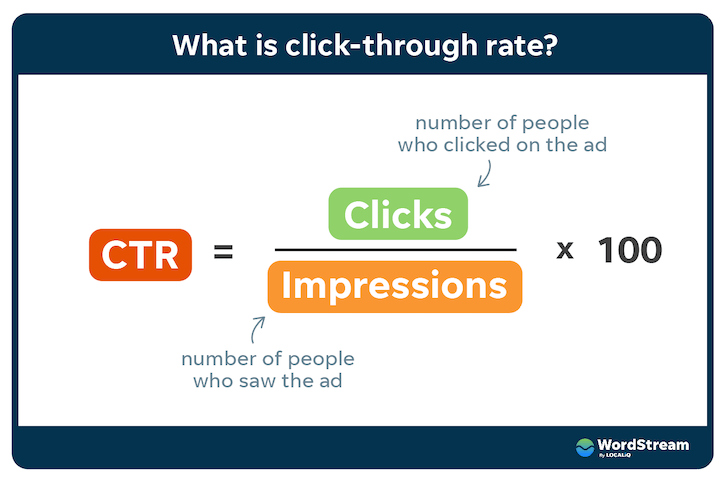
This metric measures the effectiveness of your content in directing users towards a specific action. It’s calculated by dividing the number of clicks on a link within your post by the total number of impressions (times your post is displayed).
A high CTR suggests your content is not only interesting but also effectively compels users to take the desired action, whether it’s visiting a landing page, downloading an ebook, or signing up for a webinar.
Posting a captivating Instagram photo showcasing a new product with a “Shop Now” button with a high CTR signifies that users are intrigued by the product image and actively interested in purchasing it. By analyzing your CTR, you can assess if your content is successfully bridging the gap between awareness and action.
Brand Mentions
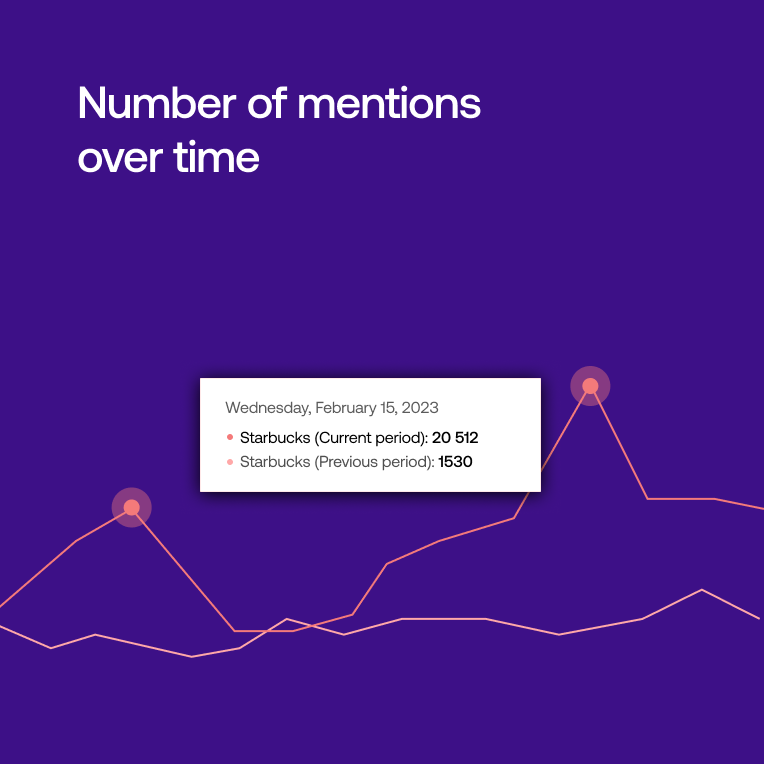
This metric tracks instances where your brand is mentioned on social media, even if it’s not directly on your accounts. These mentions provide valuable insights into brand awareness and user sentiment (positive or negative).
They can be a goldmine of information, revealing how people perceive your brand and sparking ideas for future content or brand reputation management strategies.
Similarly, when customers tweet positive reviews about your product using your brand name, this suggests a successful customer experience and potential brand advocacy. By monitoring brand mentions, you can identify brand ambassadors and leverage positive sentiment to further strengthen your brand image.
2. Reach Metrics
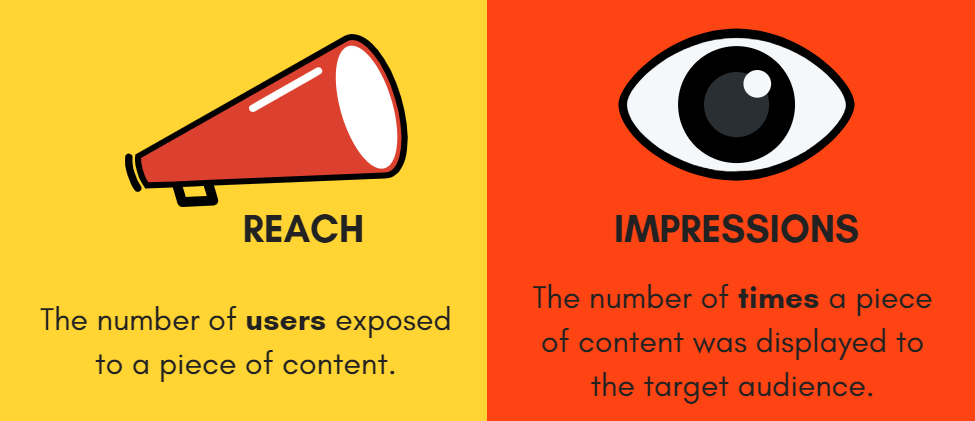
Reach metrics give you a broad view of your content’s impact. They show how many different people have seen your content, helping to increase brand awareness. Impressions (views) and reach (unique viewers) are key metrics that indicate how widely your message has spread.
Impressions
This metric shows how many times your content is displayed, regardless of user interaction. It helps gauge the overall reach of your content and understand how many people are potentially exposed to your brand message.
A high number of impressions indicates that your content is circulating within your target audience, even if engagement metrics haven’t skyrocketed yet.
When you create a fun and visually appealing video ad on Facebook, a high number of impressions for the ad indicates that many users saw it, even if they didn’t necessarily click or comment. This suggests that your ad is generating brand awareness and potentially sparking curiosity about your brand.
Reach
This metric measures the number of unique users who saw your content at least once. It helps understand how many people you’re potentially reaching with your social media efforts. Reach is a broader indicator of exposure compared to impressions, as it focuses on unique users rather than total views.
You share a Twitter thread with insightful industry news that has a high reach. This indicates that the thread was seen by a wide audience on the platform and has the potential to spark conversation or establish you as an authority in your field. By analyzing reach, you can assess how effectively your content is spreading brand awareness and attracting new followers.
Follower Growth
Track how your follower count grows over time. A steady increase in followers suggests you’re attracting a relevant audience interested in your content and brand. This organic growth signifies that your social media efforts are resonating and building a loyal community around your brand.
When you consistently post engaging Instagram stories and informative Twitter threads, leading to a consistent rise in followers, this indicates that your content strategy is working and attracting a growing audience who finds your brand valuable.
3. Conversion Metrics
Conversion metrics show how well your content is performing. They track how many people are actually taking the action you want them to, like making a purchase or signing up for something. These metrics, including sales, signups, and downloads, indicate how successful your content is at turning interest into tangible results.
Website Clicks
This metric tracks how many times users click on links within your social media posts that lead them to your website. This is a direct indicator of potential conversions, as users who click through may be interested in learning more about your product, service, or brand story.
A high number of website clicks suggests that your social media content is successfully piquing user interest and driving them towards your website, where they can potentially convert into leads or customers.
Sharing a Facebook post promoting a free webinar on social media marketing best practices leads to a high number of website clicks on the post suggests that people are interested in attending the webinar and potentially becoming future customers for your social media marketing services.
Lead Generation
Monitor how many leads (potential customers) you generate through social media, such as email sign-ups or contact form submissions. This metric helps you understand how effectively your social media efforts are driving interest and capturing valuable lead information.
By analyzing lead generation metrics, you can assess the effectiveness of your social media campaigns in attracting potential customers and building your sales pipeline.
Launching a well-targeted LinkedIn ad campaign offering a free downloadable guide on industry best practices generates a significant number of leads in your target market. Therefore in return, indicating its effectiveness in attracting potential customers who are interested in learning more about your expertise.
Sales Conversions
If your social media efforts directly lead to sales, track how many sales can be attributed to social media referrals. This metric helps pinpoint the impact of social media on your revenue generation and allows you to measure the return on investment (ROI) of your social media campaigns.
By analyzing sales conversions, you can understand how much social media contributes to your bottom line and identify which campaigns are driving the most sales.
Share a special discount code on Twitter for your online store. You then track the number of sales that come from users who clicked on the code. This helps you measure the effectiveness of your social media promotion in driving sales and identify which types of promotions resonate best with your audience.
4. Brand Awareness Metrics
Brand awareness metrics pay attention to how often people hear about your brand. They indicate how well-known your brand is. Metrics like mentions (how often your brand is talked about online), growth in social media followers, and website traffic show how effectively your brand is standing out and getting noticed.
Branded Hashtag Usage
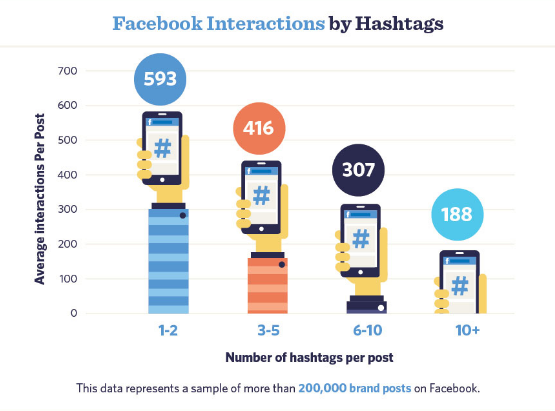
Track how often people use your branded hashtags in their posts. This indicates brand awareness and user-generated content promotion. Branded hashtags encourage user engagement and can help expand the reach of your campaign organically.
By monitoring branded hashtag usage, you can gauge how well your hashtags are resonating with your audience and potentially identify brand advocates who are using your hashtags to promote your brand.
Brand Search Volume
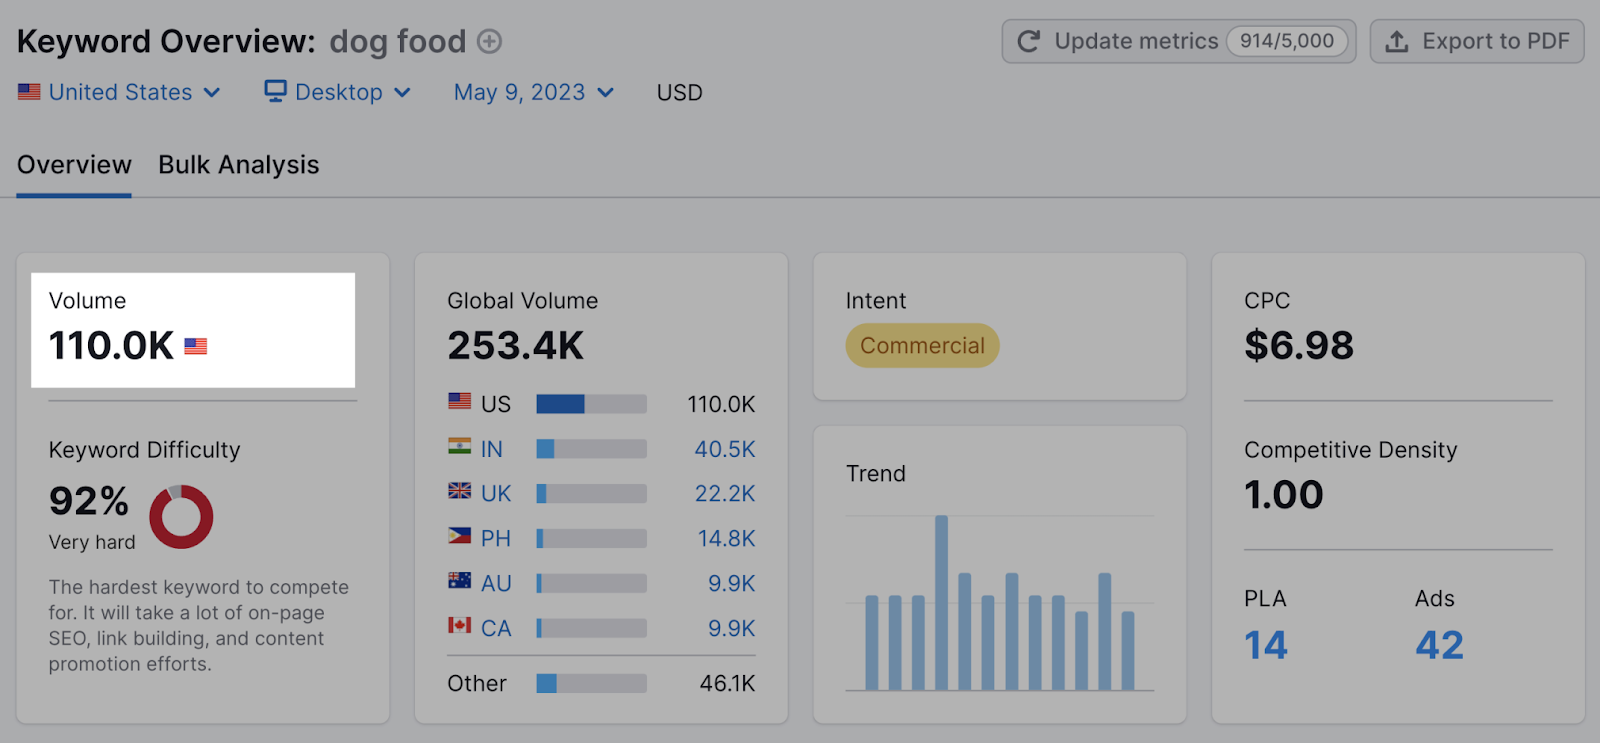
Monitor how often your brand name is searched for on social media platforms. This indicates brand recognition and potential interest.
A high brand search volume suggests that people are actively looking for your brand on social media, which could be due to brand awareness campaigns, positive word-of-mouth, or recent news mentions.
Increased brand searches on Twitter after a successful influencer collaboration campaign suggests that the campaign is generating brand awareness and potentially attracting new followers who are interested in learning more about your brand.
5. Audience Insights
Audience insights reveal what your fans really like! They’re more than just basic information like age or location; they show you what your audience is interested in and how they behave. Understanding their preferences, engagement habits, and buying patterns helps you customize your message to make the biggest impact.
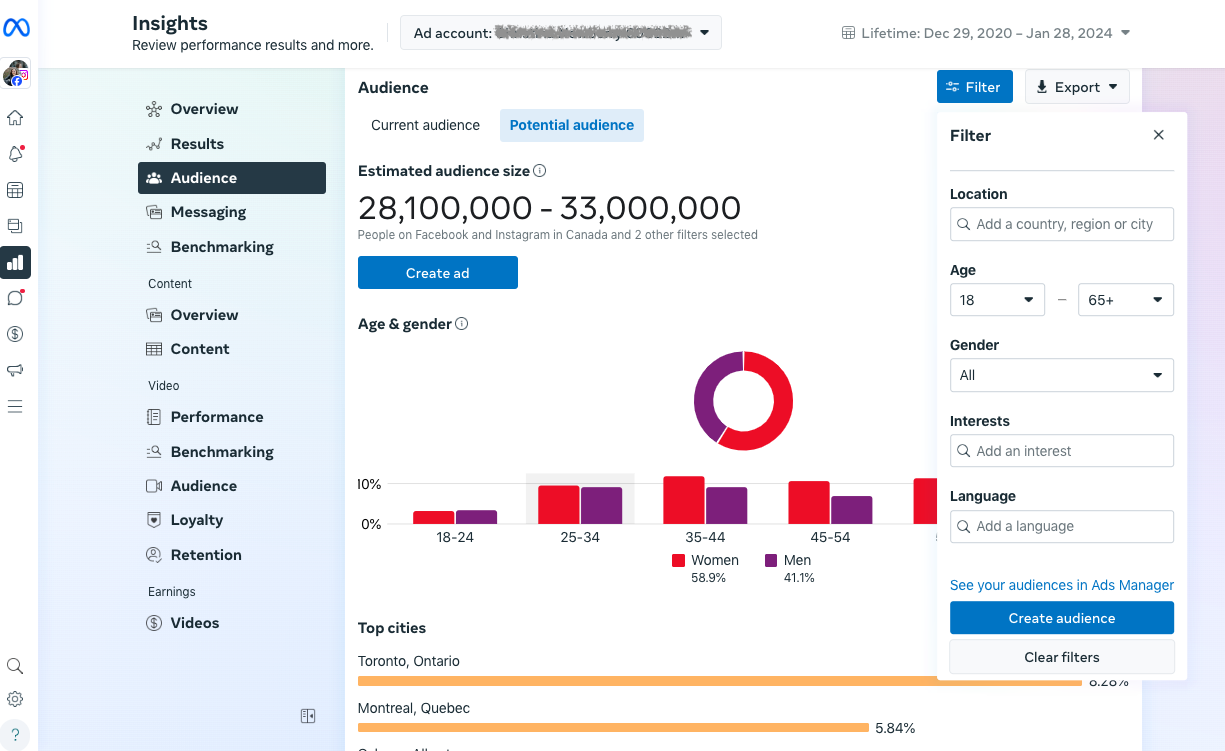
Demographics
Analyze the demographics of your audience on each platform (age, location, interests). This helps you tailor your content to their preferences and ensure you’re reaching the right audience. By understanding your audience demographics, you can create content that resonates with their specific interests and needs.
Looking at your Facebook audience insights reveals a high concentration of young professionals interested in business news. You can then adjust your content strategy to cater to their interests by focusing on business tips, industry trends, and insights relevant to their career stage.
Active Times
Identify the times when your audience is most active on each platform. This helps you schedule posts for optimal visibility and engagement. By understanding your audience’s active times, you can ensure that your content is being seen when your followers are most likely to be online and engaged.
If your Twitter analytics show a spike in activity during weekdays after lunchtime, you can schedule tweets during that time for better reach and potentially higher engagement rates.
6. Competitive Analysis
Competitive analysis in social media metrics involves comparing follower growth, engagement rate, and content performance with competitors. It helps you understand your brand’s position, refine your strategy, and improve your social media presence.
Competitor Follower Growth
Track how your competitors’ follower counts are growing compared to yours. This helps benchmark your performance and identify potential areas for improvement.
By analyzing your competitor’s follower growth, you can gain insights into their social media strategies and identify tactics that are working well for them
7. Social Share of Voice and Sentiment
Social Share of Voice (SSoV) measures your brand’s visibility compared to competitors on social media. Sentiment analysis evaluates the tone (positive, negative, neutral) of mentions to gauge brand perception. Combining these metrics provides a comprehensive view of your brand’s social media presence and reputation.
Beyond the core metrics we’ve explored, social media offers powerful tools for understanding your brand’s position within your industry and the emotions users associate with it. Here’s a closer look at two key metrics:
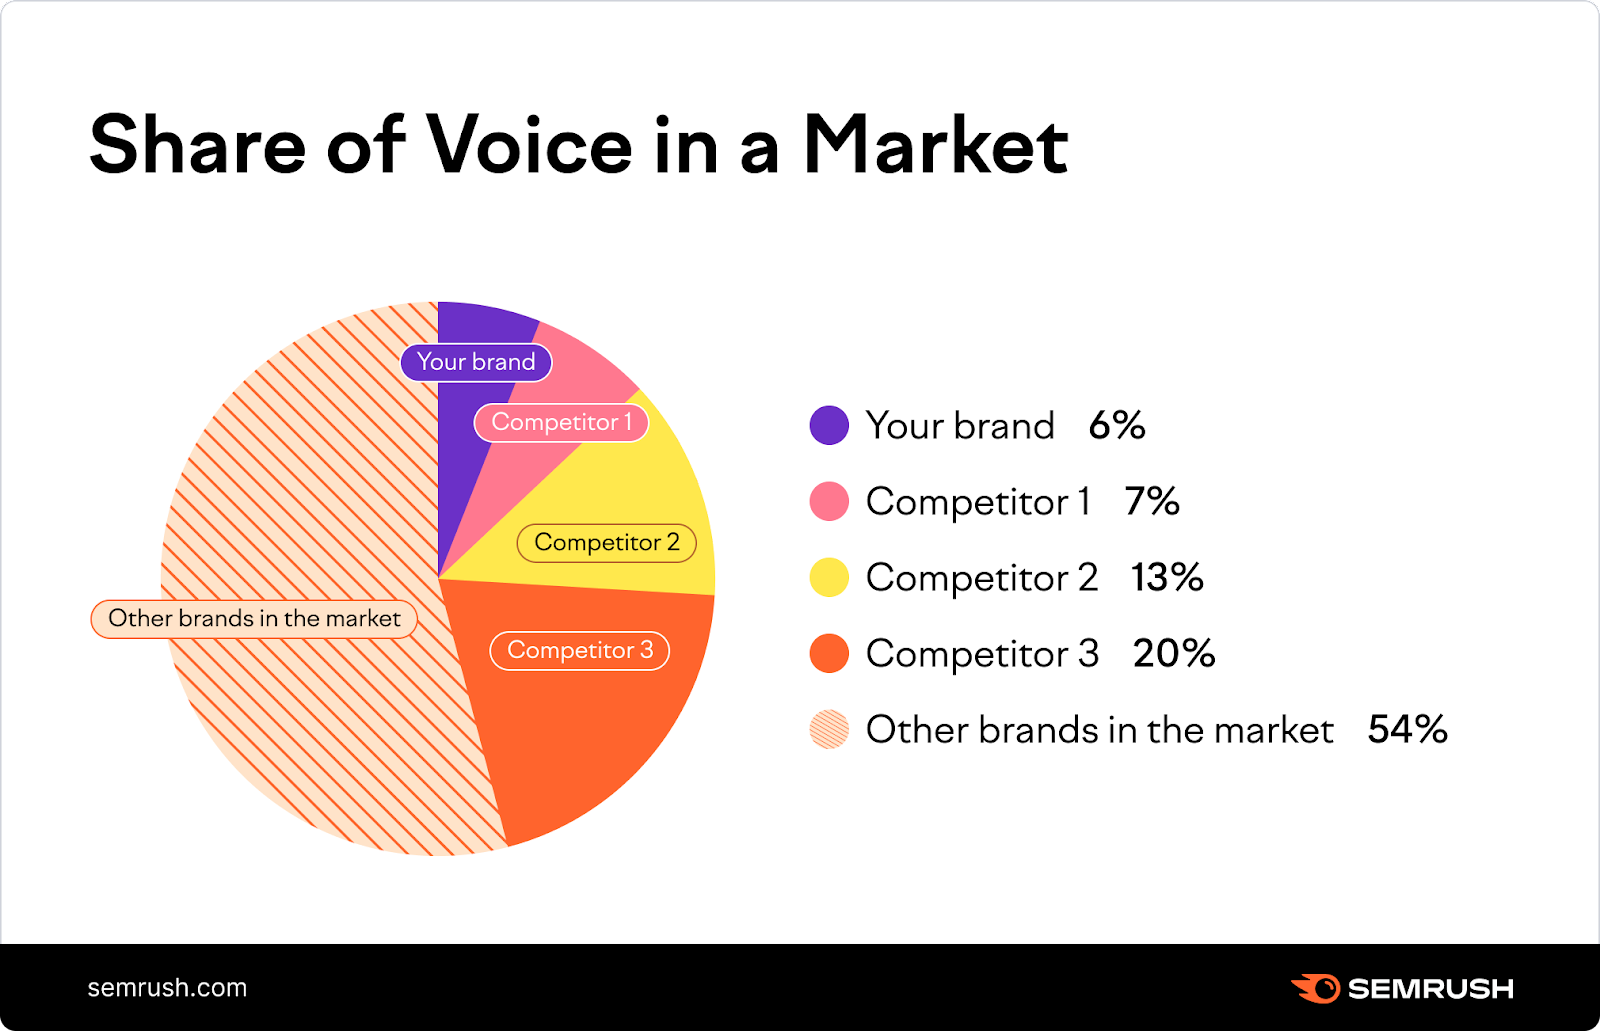
Social Share of Voice (SSoV)
Ever wondered how much of the online buzz surrounds your brand compared to your competitors? SSoV helps you answer that question. It measures the percentage of social media conversations within your industry that mention your brand.
What if a giant online conversation is happening about your industry. SSoV tells you what portion of that conversation is focused on your brand. Knowing this allows you to gauge your brand visibility and relevance in the market.
Calculating SSoV
- Track all mentions of your brand across social media platforms, including both direct mentions (using your brand handle) and indirect mentions (referencing your brand name without tagging).
- Repeat step 1 for your key competitors.
- Combine the total mentions for your brand and your competitors to get the total industry mentions.
- Divide your brand mentions by the total industry mentions and multiply by 100 to express your SSoV as a percentage.
Why SSoV Matters
A high SSoV indicates strong brand awareness and a significant presence within your industry’s social media landscape. By monitoring your SSoV over time, you can track the effectiveness of your social media efforts and identify areas for improvement.
Social Sentiment
SSoV tells you how much people are talking about you, but social sentiment reveals how they feel about you. It analyzes the emotions and attitudes expressed in conversations about your brand online.
Are people praising your products, expressing frustration with customer service, or simply sharing positive brand experiences?
Measuring Sentiment:
Accurately measuring social sentiment often requires the help of social media analytics tools that can process and categorize language based on context and sentiment. These tools can help you understand the overall sentiment surrounding your brand and identify areas where you might need to address customer concerns or capitalize on positive experiences.
Understanding Sentiment:
These two metrics, Social Share of Voice and Sentiment, work together to paint a comprehensive picture of your brand’s presence and perception within the online social landscape. By monitoring and analyzing them, you can gain valuable insights to refine your social media strategy, strengthen your brand image, and achieve your social media goals.
How To Build Your Social Media Metrics Dashboard?
Here’s a step-by-step guide to setting up your own social media metrics dashboard:
Step 1: Define Your Goals & Audience
Before diving into data, take a step back. What are your overall social media goals? Do you want to increase brand awareness, drive website traffic, generate leads, or boost sales? Understanding your goals helps you choose the most relevant metrics to track on your dashboard.
Who is your target audience? Knowing their demographics, interests, and social media habits allows you to tailor your metrics selection. For example, if your target audience is young professionals on LinkedIn, you might prioritize metrics like engagement on professional content and lead generation from LinkedIn forms.
Step 2: Choose Your Metrics
Based on your goals and audience, select the key metrics you want to track. Refer to the different metric categories we discussed earlier (Engagement, Reach, Conversion, Brand Awareness, Audience Insights). Don’t overload your dashboard – focus on 8-10 metrics that provide a clear picture of your performance.
Step 3: Select Your Data Source
Most social media platforms offer built-in analytics tools that provide basic metrics. However, for a more comprehensive picture, consider using social media management platforms (like Hootsuite, Buffer, Sprout Social, DigiXL Media) that offer advanced analytics features and the ability to track data across multiple platforms.
Step 4: Choose a Social Media Management Platform (SMMP)
SMMPs like Hootsuite, Buffer, Sprout Social or DigiXL Media offer a central hub for managing your social media presence across various platforms. These platforms typically integrate with native analytics from each social media network, allowing you to view data from all your accounts in one place.
Step 5: Design & Build Your Dashboard
Now comes the fun part – designing your dashboard! Here are some tips:
- Visual Appeal: Use clear and concise charts and graphs (bars, lines, pies) to represent your metrics. Employ colour-coding for easy differentiation.
- Organization: Group related metrics together for better flow and understanding.
- Time Period: Allow users to easily switch between viewing data for specific periods (day, week, month, year).
- Customization: Many tools allow you to add filters to focus on specific social media platforms, demographics, or campaigns.
Most SMMPs offer customizable dashboards. You can drag-and-drop widgets to display the chosen metrics for each social media platform. Many platforms allow filtering by specific timeframes or campaigns.
Here’s a platform-specific breakdown for further customization
- Twitter: Track Tweet performance, analyze follower demographics, and monitor brand mentions.
- Instagram: Gain insights into follower growth, story engagement, and post-performance by reach and impressions.
- Facebook: Analyze page demographics, track post engagement, and monitor ad campaign performance
- LinkedIn: Measure post engagement, track follower growth by demographics, and analyze content performance for industry benchmarks.
- Pinterest: See pin impressions, track engagement through saves and clicks, and monitor audience demographics.
Step 6: Monitor & Refine
Your dashboard is a living document – monitor your metrics regularly and analyze trends. Are you meeting your goals? Identify areas for improvement and adjust your strategy accordingly. Update your dashboard as needed to reflect changes in your goals or the addition of new metrics.
Step 7: Share Your Dashboard
If you’re working with a team, share your social media metrics dashboard to ensure everyone is aligned on goals and progress. This fosters collaboration and data-driven decision-making across the board.
Conclusion
Tracking social media marketing metrics is essential for improving conversions in 2024 and beyond. By monitoring key indicators such as engagement rates, click-through rates, conversion rates, and sentiment analysis, businesses can gain valuable insights into the effectiveness of their social media strategies.
This allows for informed decision-making, optimization of content, and targeted efforts to enhance audience engagement and drive conversions. With a data-driven approach to social media metrics tracking, businesses can better understand their audience, refine their messaging, and ultimately achieve their conversion goals in the dynamic landscape of social media marketing.
Connect with us on our social media platforms on Twitter, LinkedIn and Facebook and become part of a vibrant community of like-minded individuals. We share insightful content, engage in stimulating discussions, and provide updates on the latest industry happenings!