
Instagram continues to captivate audiences worldwide! Boasting a staggering 2.4 billion registered users as of 2024, the platform shows no signs of slowing down.
Engagement is soaring as well, with the average user spending a significant 33 minutes per day on Instagram.
This marks a dramatic increase from the 15-minute average recorded in 2019, highlighting a near-doubling in usage within just four years.
That’s some serious dedicated time you can leverage for your brand. Let’s explore some eye-opening Instagram statistics that will illuminate the platform’s potential for marketers:
What are the General Instagram Statistics?
Learn interesting facts with these general Instagram stats. Find out who uses Instagram and how people interact with content on the platform.
Here are some key general Instagram statistics for marketers to consider:
- Massive User Base
Instagram boasts over 2 billion monthly active users. While not quite reaching Facebook’s user count, it’s still a gigantic audience with immense potential. - Top Visited Platform
Instagram ranks as the 4th most visited website globally. This high ranking indicates its widespread popularity and the potential for brand exposure. - Highly Engaged Users
Approximately 20.3% of all active internet users access Instagram monthly, showcasing its widespread adoption. That means a significant portion of your target audience is likely active on the platform. - Daily Habit for Many
A healthy 35.71% of active mobile internet users access Instagram monthly, which is roughly the same population of North America and Europe combined. This suggests Instagram has become a daily habit for many users. - Dominant Age Group
The 18-34 age group makes up the largest user demographic, contributing to 61% of total Instagram users. If your target audience falls within this range, Instagram is a prime platform to connect with them. - High Search Volume
“Instagram” is the 10th most searched term on Google, with a massive search volume of 338 million. This highlights the platform’s popularity and the potential for organic reach through strategic content. - Low Only-Instagram Users
Only 0.1% of Instagram users are on Instagram, indicating a high overlap with other social media platforms. This allows for cross-promotion opportunities with your other social media channels.
These Instagram stats paint a clear picture: Instagram is a powerful platform with a massive and engaged user base, particularly among younger demographics.
By understanding these general trends, marketers can tailor their strategies to effectively reach their target audience and achieve their marketing goals.
Instagram Audience and Demographic Statistics
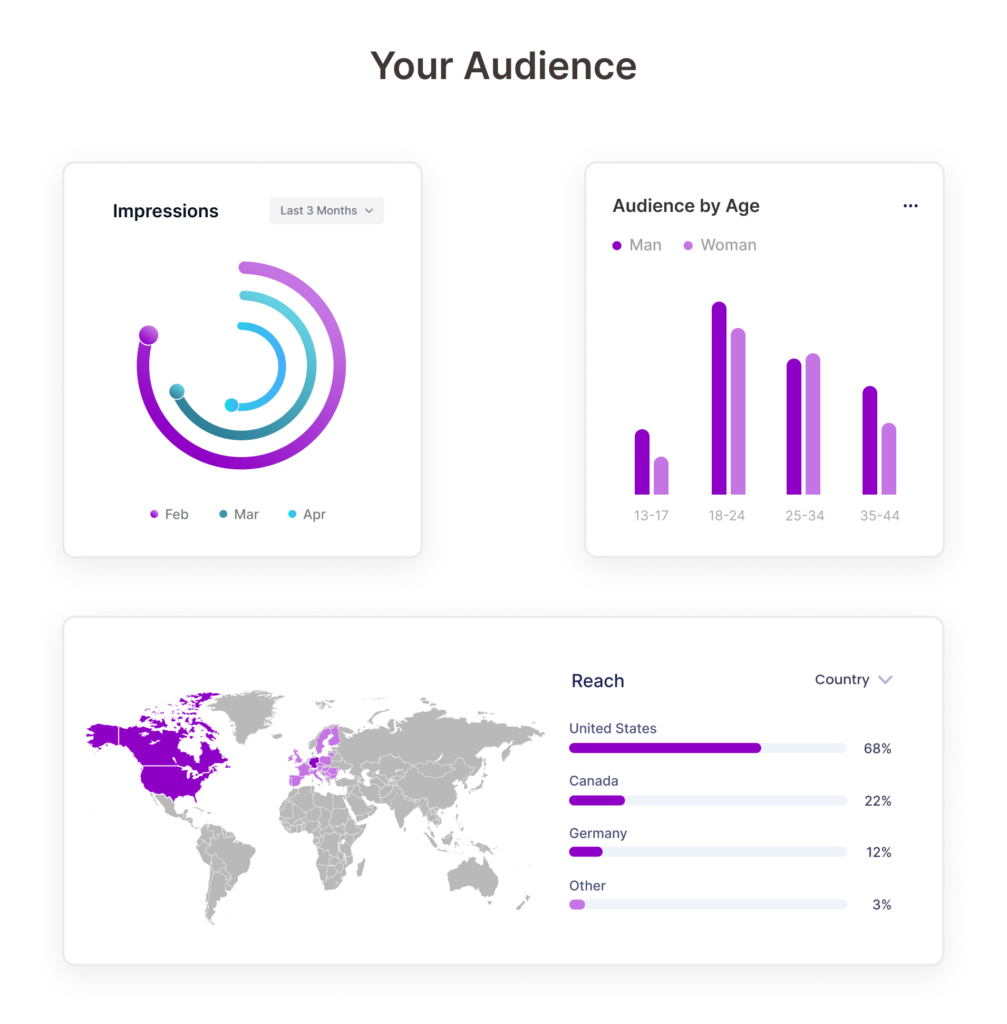
Understanding your target audience is crucial for any successful marketing strategy, and Instagram provides valuable insights in this area. Here’s a breakdown of key audience and demographic statistics for you to leverage:
1. Age Demographics
Millennial and Gen Z Dominate: The platform skews young, with the 18-34 age group comprising a whopping 61% of total users. This dominance by Millennials and Gen Z makes Instagram ideal for brands targeting these demographics.
Reaching a Broader Audience: While younger users reign supreme, Instagram boasts a presence across all age groups. 29% of users fall between 35-49, with 13% aged 50-64 and even a growing segment of 13% above 65. This allows you to tailor content for specific age groups within your target market.
2. Gender
Near Perfect Balance: Instagram avoids a major gender skew, with 49.7% female and 50.3% male users globally. This even split means you can craft messaging that resonates with both genders.
Data Limitations
- It’s important to acknowledge that the data currently available on Instagram demographics primarily focuses on a binary (male/female) split. Non-binary users are not explicitly accounted for, which could be a factor in some regional variations.
- While gender is a valuable demographic indicator, remember that it’s just one piece of the puzzle. Consider other factors like age, interests, and location to create content that resonates with your target audience.
3. Location
Global Reach: Instagram boasts a significant presence worldwide, with the highest concentrations in:
- As of March 2024, India boasts the largest Instagram audience globally, with 362.9 million active users, followed by Brazil with 122.9 million, Indonesia with 104.8 million, and Turkey with 56.7 million.
- United States: In the United States, 75% of individuals aged 18-24 use Instagram, while 57% of those aged 25-29 are active on the platform.
While these top locations are important, remember user demographics can vary by region. Research specific countries or regions within your target market for a more nuanced understanding.
4. Other Demographics
Income and Education: While specific data isn’t readily available, anecdotal evidence suggests a mix of income levels and educational backgrounds on Instagram. Tailor your content to resonate with the values and aspirations of your target audience segment.
5. Beyond the Numbers
Remember, statistics paint a general picture. To truly understand your audience, consider these additional points:
- Interests and Passions: What are your target audience’s hobbies and interests? Align your content with their passions to grab their attention.
- Online Behavior: How do they typically use Instagram? Do they prefer Stories, Reels, or static posts? Cater your content format to their preferred consumption style.
- Psychographics: Understanding their values, aspirations, and pain points allows you to create content that resonates on a deeper level.
By combining audience and demographic statistics with deeper audience insights, you can develop a comprehensive understanding of who you’re trying to reach on Instagram.
Instagram Usage Statistics
In the US alone, Instagram boasts impressive engagement with a staggering 59% of users actively checking the app daily. Weekly usage sits at a healthy 21%, with another 20% logging in less frequently.
Every minute, approximately 66,000 photos are shared on Instagram, although the quality of these photos varies. Nonetheless, this volume of content is quite significant.
About 69.9% of Instagram users use the app to post or share photos or videos, while 64% use it to find funny or entertaining content. Nearly half of Instagram users also use the app to stay updated with the news.
Instagram Ad Statistics
Here’s a breakdown of some key Instagram Ad Statistics for 2024 along with resources where you can find them:
- Massive Reach: Instagram advertising boasts a significant reach, with estimates suggesting it can reach over 223 million users in India alone and over 143 million users in the United States
- Revenue Growth: Whop predicts that Instagram’s revenue will reach $59 billion in 2024, marking a 17.9% rise from the $50.6 billion generated in 2023 through ad revenue. This growth includes an increase from $43 billion in 2022 to an estimated $43 per user in 2024.
- Ad Formats: As per Oberlo’s findings, Instagram saw a surge in ad revenue, reaching $50.58 billion in 2023. In-feed ads played a significant role in this revenue, while ads within Instagram Stories accounted for 26.7% of the platform’s total ad revenue. Projections suggest that Instagram ad revenue will climb to $59.6 billion in 2024.
Instagram Stories and Reels Statistics
Instagram provides a variety of content options, including Stories and Reels, which are particularly popular. Here’s an overview of recent statistics for these formats:
After a decline in previous years, the reach rate for Instagram Stories is increasing again. According to a RivalIQ study, smaller brands with fewer than 10k followers experienced a significant 35% increase in Story reach rate. Other groups saw minor increases, while mid-size brands’ reach rate remained stable.
The same study found that the number of frames in your Instagram Stories affects audience retention. After a notable drop from the first two frames, the median retention rate stabilizes at 81% by the fourth frame. However, it dips below 75% after the seventh frame.
- Mid-sized brands (10k-50k followers) achieve an average reach rate of 2.6% with their Instagram Stories.
- Large brands (50k-200k followers) achieve an average reach rate of 1.6% with their Instagram Stories.
- Major brands with over 200k followers achieve an average reach rate of 1.2% with their Instagram Stories.
Consumers prefer short narrative Stories with a mix of photos, videos, and text, according to the RivalIQ study. Thirty-five percent of consumers prefer these, while Stories with quizzes and polls are also popular.
Reels have consistently outperformed other content types in terms of reach. A Socialinsider study found that Reels have an average reach rate of 30.81%, which is double that of other content formats.
- Every minute, approximately 694,000 Instagram Reels are shared or sent via direct message (DM).
- Instagram Reels posted by accounts with 50,000 to 45 million followers typically reach an average of over 47,000 followers.
- On average, an Instagram Reel receives 243 likes, is saved 28 times, and receives 8 comments.
Reels also surpass other post types in impressions, with twice as many impressions.
Business Instagram Statistics
Instagram is a powerful platform for businesses, offering various opportunities for engagement and sales. Here are some key statistics:
- 44% of Instagram users shop on the app weekly: Whether it’s making a purchase or gathering information for future buys, Instagram serves as a research and shopping tool.
- Average Instagram Business account posts 1.55 times per day: Consistency is crucial to maintaining audience engagement. Photos are the most common type of post, making up 41.7% of main feed posts, followed by videos at 38.2%, and carousel posts at 20%.
- 62.4% of social media users follow or research brands or products on Instagram: More than 60% of social media users prefer using Instagram for brand and product research, highlighting its importance for businesses.
- 97.6% of U.S. marketers use Instagram: Due to its diverse content formats and creator tools, Instagram remains a popular choice for marketers. Conversations with customers in Instagram DMs convert 70% of the time, making direct messaging a powerful tool for businesses.
- Product-tagging increases sales by 37%: Businesses that tag their products in posts on Instagram experience higher sales than those who don’t.
Instagram stats provide a unique opportunity for businesses to connect with customers through valuable content and personalized customer service.
Instagram Influencer Marketing Statistics
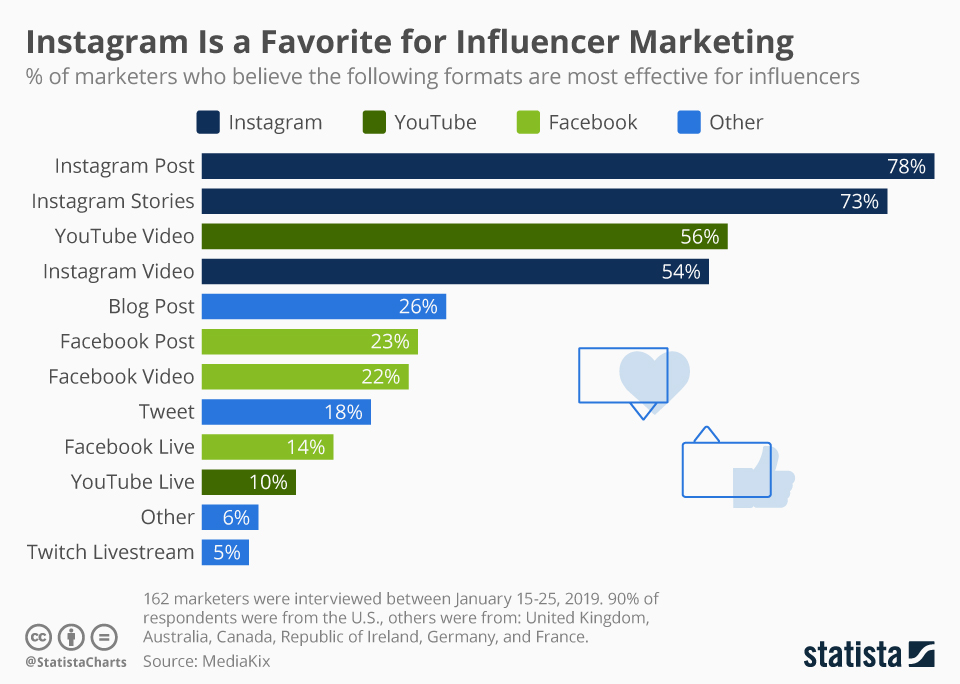
A whopping 80.8% of marketers plan to leverage Instagram for their Influencer marketing campaigns in 2024, solidifying its position as the go-to platform.
According to Statista, this dominance aligns perfectly with the influencer landscape on Instagram. Nano-influencers (1,000-10,000 followers) make up a staggering 65.39% of all influencer accounts, followed by micro-influencers (10,000-50,000 followers) at 27.73%.
This abundance of choice empowers brands to find the perfect influencer fit – someone with a targeted niche and a highly engaged audience maximizing campaign effectiveness.
Instagram Statistics FAQs
1. What Kind of Content Performs Best on Instagram?
Images continue to reign supreme, accounting for roughly 42.2% of all content shared. Carousels, offering a multi-image format, are another popular choice, making up about 26.2% of shared content.
2. What are Instagram Reels and How Can I Use Them Effectively?
Reels offer a dynamic way to create short, engaging videos similar to TikTok. Adding music, text overlays, and creative effects can help your Reels stand out and attract new viewers.
3. How Can I Utilize Instagram Insights to Improve My Strategy?
Instagram Insights provides valuable data about your audience demographics, post-performance, and engagement metrics. By analyzing this data, you can tailor your content strategy to resonate better with your audience.
4. How Can I Make Money on Instagram?
There are several ways to monetize your Instagram presence. If you have a large, engaged following, you can partner with brands for sponsored posts or product collaborations. Affiliate marketing or selling your products through Instagram Shopping are other potential income avenues
5. How Often Do People Check Instagram?
Engagement is high on Instagram. In the US, for example, an impressive 59% of users access the platform daily, with another 21% checking in weekly.
6. How Can I Increase Engagement on My Instagram Posts?
Engagement goes beyond likes and comments. Responding to comments, running contests, and collaborating with other users are all great ways to boost engagement and build a loyal following.
The Quirky and Fun Instagram Facts for Marketers
While statistics paint a clear picture of Instagram’s power as a marketing tool, some lesser-known facts reveal the platform’s personality and user behavior. Here’s a glimpse into some interesting tidbits that can inform your marketing strategies:
1. The Power of the Pound Sign
Hashtags are a cornerstone of Instagram discovery, but did you know the platform limits posts to 30 hashtags? This encourages strategic selection, pushing marketers to focus on the most relevant ones for their target audience.
2. Emoji Enthusiasts
Emojis are a global language on Instagram, with over 56% of comments and captions containing at least one emoji. Consider incorporating relevant emojis strategically to enhance your captions’ emotional impact and cater to visual communication styles.
3. Weekend Warriors (and Night Owls)
Engagement dips during weekdays, with Saturdays boasting the highest average engagement rate (4.01%) [Later]. This suggests weekends are prime time for posting eye-catching content. However, evenings (7 pm to 10 pm) across all time zones also see a surge in activity, catering to those late-night scrollers.
4. Stories Rule, But Highlights Last
Instagram Stories offer a fleeting glimpse into your brand’s world, disappearing after 24 hours. However, Stories Highlights, curated collections of past stories, can hold a permanent place on your profile. Marketers can leverage Highlights to showcase brand values, product tutorials, or customer testimonials, offering a more long-term engagement opportunity.
5. The Allure of Long-Form Content
While concise captions tend to perform better, Instagram allows captions up to 2,200 characters. This opens doors for in-depth storytelling and creative content formats like poems or mini-fiction related to your brand. Experiment with caption length to see what resonates best with your audience.
6. Going Live with Authenticity
Instagram Live offers a real-time connection with your audience. Interestingly, 80% of viewers prefer watching live videos from a brand over reading a blog post. Consider hosting live Q&A sessions, product demos, or behind-the-scenes glimpses to foster a sense of community and authenticity.
7. Location, Location, Location (and Stickers)
Adding location tags to your posts can increase discoverability, especially for local businesses. Additionally, Instagram Stories stickers like location tags and polls can boost engagement by encouraging user interaction.
8. The Power of User-Generated Content (UGC)
84% of millennials trust recommendations from friends, family, and influencers over traditional advertising. Partnering with micro-influencers or encouraging user-generated content with branded hashtags can be a powerful and cost-effective marketing strategy.
9. The Filter Frenzy
Instagram users love filters! Studies suggest that photos with filters receive 21% more likes than unfiltered ones [Curalate]. Experimenting with relevant filters can enhance the visual appeal of your content and cater to user preferences.
10. The Explore Page
Remember, there’s more to Instagram than just the main feed. Explore the “Discover” tab to understand trending content and hashtags. Additionally, utilize Instagram Reels, a short-form video format, to tap into a new audience segment and showcase your brand’s creativity.
By understanding these fun facts and incorporating them into your marketing strategy, you can unlock new opportunities to connect with your audience and achieve your brand goals on Instagram.
Conclusion
Instagram is a great place for social media marketing. By looking at the latest stats and fun facts about how people use the app, you can learn how to improve your marketing strategy.
Successful marketing on Instagram is not just about following trends; it’s also about being real, understanding your audience, and being creative. Try out the tips and ideas mentioned here, interact with your audience, and see your brand do well on Instagram.
Connect with us on our social media platforms on Twitter, LinkedIn and Facebook and become part of a vibrant community of like-minded individuals. We share insightful content, engage in stimulating discussions, and provide updates on the latest industry happenings!